
Two summaries report a 70% map win rate. One team won seven of ten maps and the other won seventy of a hundred. The second record puts much tighter limits on the rate under a simple statistical model. The first is compatible with a much wider range, even before you consider opponents, roster changes or map selection. Reading only the percentage hides the difference between those records.
Start with two samples you can describe
We use invented results for one map. Each played map contributes one binary outcome, win or loss. No map names or team identities are attached to the figures. For the interval calculation, assume independent trials with a stable underlying chance within each sample. This model lets us isolate the contribution of sample size. Real competitive records need additional scrutiny before you treat either number as an estimate of the next match.
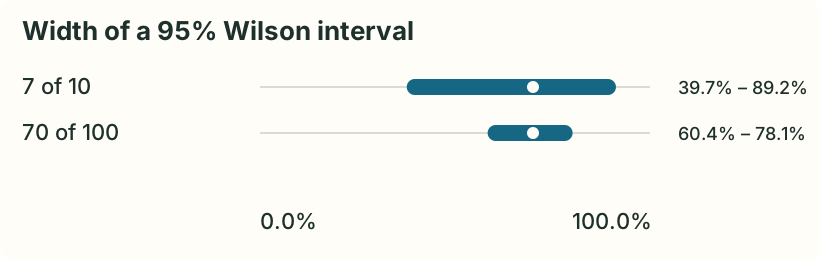
The observed proportion is wins divided by maps played. Both rows give 0.70. For a two-sided 95% Wilson interval we invert a score test for a binomial proportion, using the normal critical value approximately 1.96. The endpoints use the observed proportion, the number of trials and that critical value. The construction adjusts the centre and width with sample size, and stays within the bounds of a probability. The table gives the resulting endpoints as percentages.
| Wins / maps | Observed rate | Wilson 95% interval |
|---|---|---|
| 7 / 10 | 70% | 39.68% – 89.22% |
| 70 / 100 | 70% | 60.42% – 78.11% |
Read the intervals before you rank the teams
The ten-map interval reaches from about 40% to 89%. The hundred-map interval reaches from about 60% to 78%. Those rounded ranges support very different descriptions of the same observed percentage. One gives you a loose estimate, while the other gives you more precision within the stipulated model. The overlap between these two intervals is unsurprising because both records have exactly the same observed proportion. Overlap on its own is not a test of equality.
A 95% confidence interval describes the procedure over repeated samples under the model. It does not assign 95% probability to this particular pair of endpoints containing a fixed team skill. And the next opponent need not belong to the population that produced the records. I would show the interval beside the numerator and denominator, with a short note about which matches were eligible. The percentage on its own is too easy to transport into a context it never measured.
Ask which maps could enter the sample
On a published match record you see the maps that were played. A team may regularly pick a strong map or leave it available against particular opponents. The maps excluded during veto never supply a win or loss on that record. If the question is how often the team wins a map under a different veto procedure, the observed rate describes a selected set. A tighter interval around a selected set can simply give you a more precise description of that set.
Take two hypothetical groups of opponents. A team frequently plays a map against weaker opponents and rarely sees it against stronger opponents. The overall percentage weights those groups according to the historical schedule. If the next match belongs to the second group, the overall rate has changed meaning as an input. For a hand-checkable report, give counts by opponent level where comparable groups exist. Record whether a map was the team's pick, the opponent's pick or the decider when the source reliably provides that distinction.
Find where the hundred maps came from
An old record may include a different roster or a materially different game version. Adding those observations can make the nominal interval narrower while making the result less relevant to the current roster. Set a window before viewing the wins and losses. If a documented change divides the sample, show results from both sides with their counts. A wide interval on the more relevant period can be the honest output. That decision should follow a known break in conditions, rather than whichever cut produces a preferred number.
Maps can also share a match, opponent or tournament. One familiar opponent may account for several of the rows. The basic interval assumes trials behave independently at a fixed rate. If a few clusters supply much of the dataset, treat its nominal width as a teaching approximation. Show the concentration before making a stronger claim. With suitable records an analysis can group by series or tournament and check how sensitive the result is to leaving a whole group out.
Build a record someone can inspect
Start with a map identifier, match identifier, date, opponent, outcome and the roster or version label used in the analysis. Add the source and the decision that put each row in the sample. Keep forfeits, duplicate records and missing maps separate while deciding how they enter. A series that ended before the deciding map produced no observation of that map. Counting the unplayed decider as a loss invents evidence.
Next, aggregate wins and played maps with the rules you wrote down. Recompute the percentage from those counts and preserve a second split by the most consequential condition, such as roster period or pick status. A reader should be able to reproduce the numerator from the eligible rows. Put the Wilson calculation beside that record so the interval can be recalculated without having to trust the picture.
Reproduce the two endpoints
For the arithmetic check, let p be the observed fraction, n the number of maps and z the normal critical value. Use the centre (p + z²/(2n)) divided by (1 + z²/n). The half-width is z times the square root of p(1 − p)/n + z²/(4n²), divided by the same denominator. Subtract and add the half-width to the centre, then multiply by 100. Keep the unrounded result until the final display. The supplied example file includes this calculation.
Decide how much of the number to carry forward
For a descriptive article about a completed sample, the rate and interval may be enough if the assumptions are clear. For a forward-looking comparison, identify the opponents, map conditions and time period you want the estimate to represent. A model that shrinks small samples toward a reference may be useful, provided the reference and its weight are explicit and tested on held-out matches. That is a different estimate with additional assumptions. The interval here answers how much uncertainty comes from the binomial sample alone.
Our two constructed rows differ in evidence, even though a scoreboard would print 70% beside each. In a real comparison, I would want the source rows and the selection rule before assigning either rate to an upcoming map. If the results depend on a narrow set of opponents, record that limitation in the same place as the estimate. That makes the next comparison possible when a larger and more relevant sample arrives.